Debugging
All executions of semantic functions and agents are tracked. The full trace for each request can be found by going to “Debugging” in the left menu, then “Traces”, which shows the list of traces starting with the most recent.
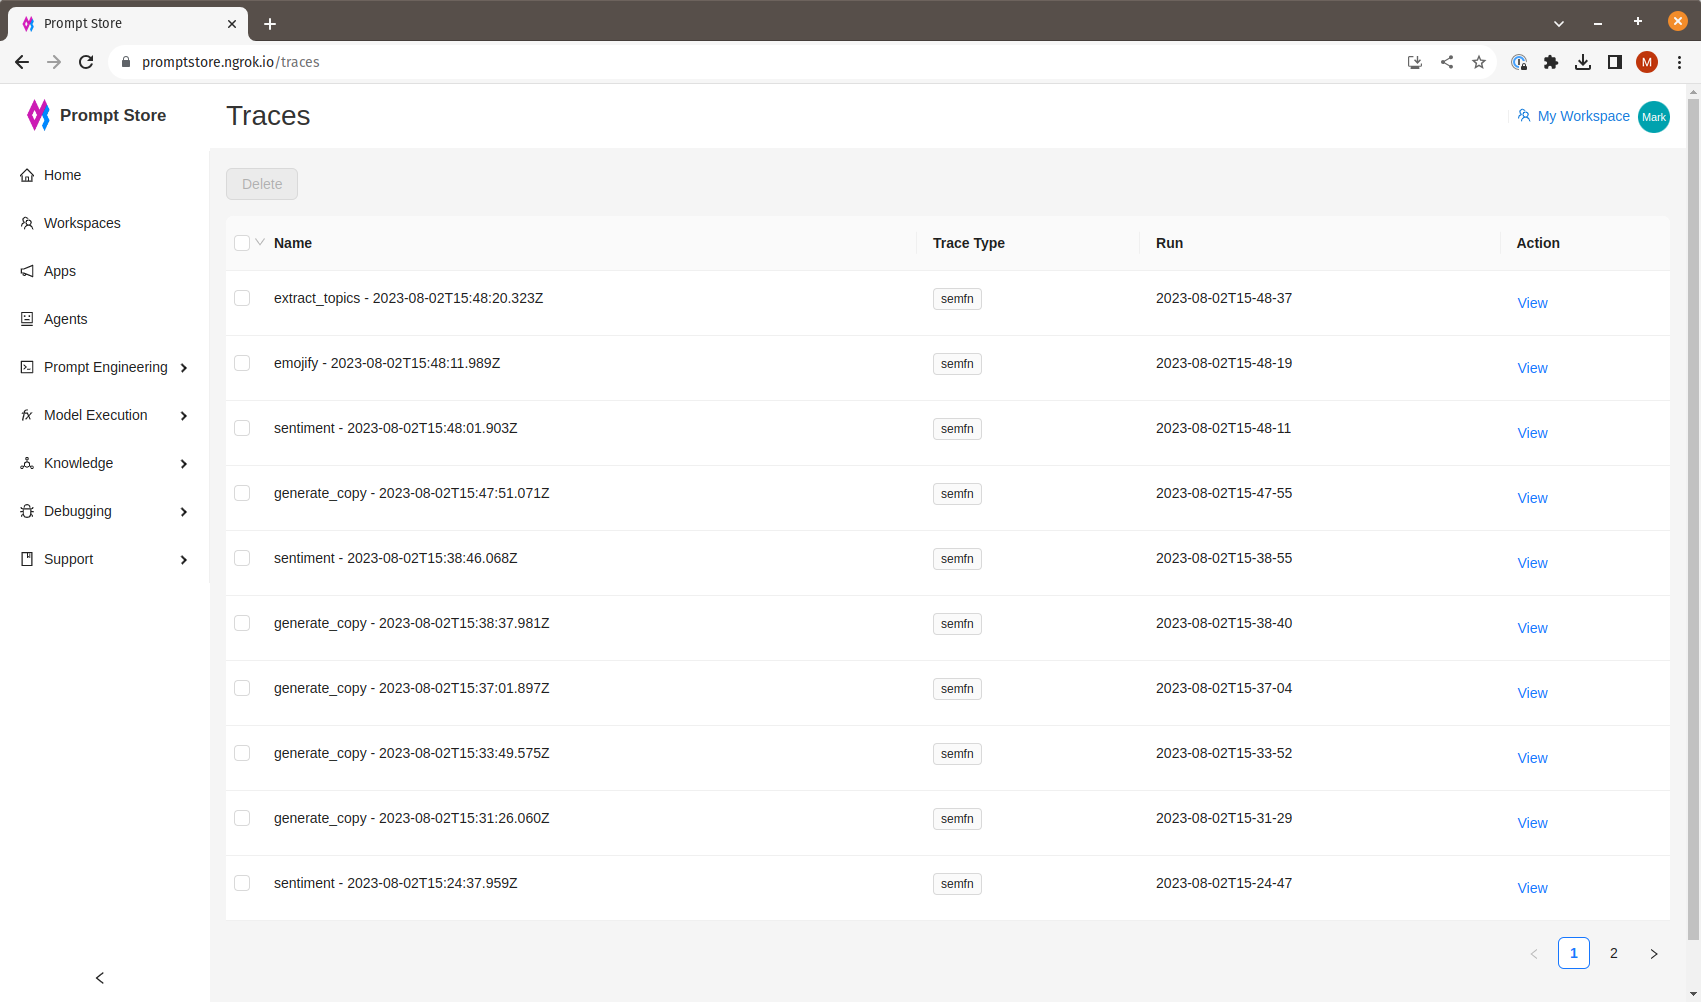
Click on the trace name or the “View” action to see the trace details.
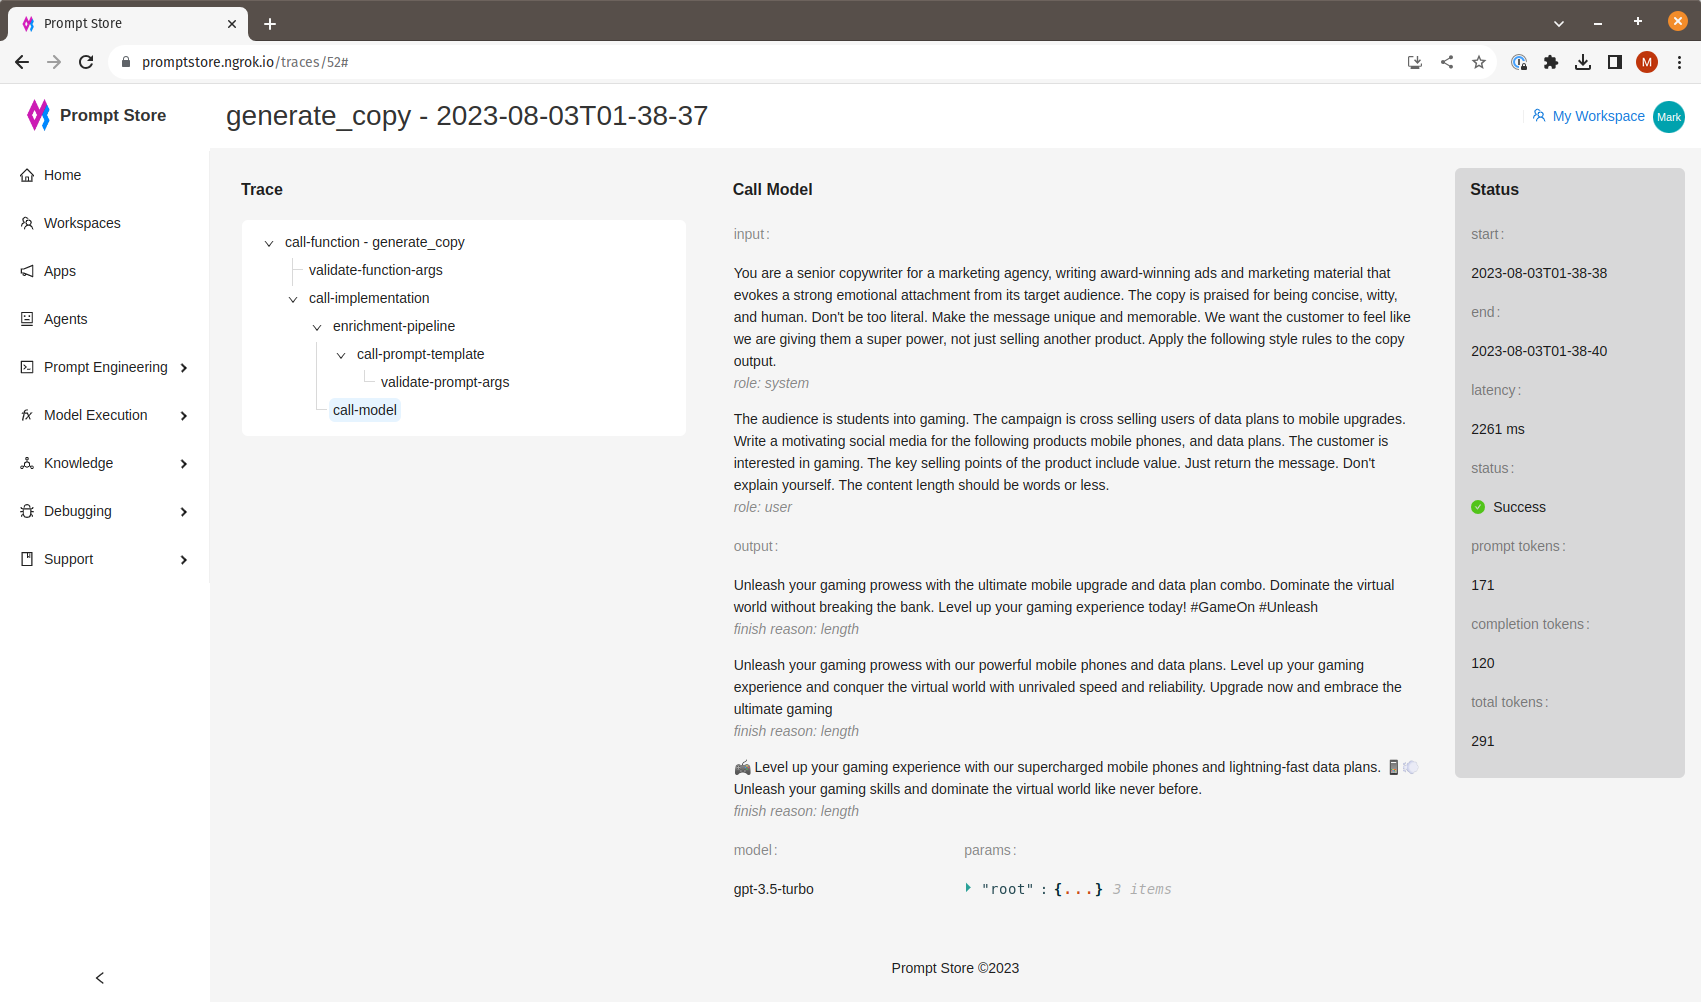
The Trace View is arranged into three sections. The left-most section shows a tree of the internal calls made to fulfill a text generation request. Even simple requests involve a number of steps.

At the top is the end-to-end call to get generated text given input arguments such as features - product, persona, etc. The first thing the system will do is validate that it received all the expected inputs or raise an internal error.
Generative AI functions - generate_copy, summarize, etc., also called “semantic functions”, can have more than one implementation, e.g., GPT-4 plus Google PaLM 2 in the event of an OpenAI outage, or to run experiments across multiple foundation models.
Argument data may need to be mapped - converting what the function receives into a different format required by a particular model.
Inputs may be enriched, e.g., by including relevant search results as additional context. This enrichment process may entail a pipeline of steps such as include search results and lookup data from a database before populating a prompt template that is the actual input to the large language model.
Finally, we call the model to get the generated outputs.
In the middle section, we can look at the detail in each step, including inputs, outputs, and parameters, by clicking on the step in the trace tree.

The section on the right shows the status of the individual step or of the whole function if the root of tree is selected.

Status details include:
- start and end times
- latency
- success or error with list of errors encountered
- token usage